How to Improve Production Line Productivity?

Time:2026-09-09 Author:Sienna
0%

Improving a production line is not achieved by simply asking workers to move faster. It begins with observing the work as it happens. A supervisor may notice a six-minute material search, an awkward reach, or a machine waiting for inspection. These small delays can quietly reduce daily output. The real question is how to improve production line productivity without weakening quality, safety, or employee trust.

Taiichi Ohno, the architect of the Toyota Production System, said, “Without standards, there can be no kaizen.” His principle remains practical today. Clear work standards help teams measure cycle time, identify bottlenecks, and compare actual performance with expected results. Simple tools can help, including visual boards, downtime records, preventive maintenance schedules, and short daily meetings. Operators should also be invited to explain why a process fails. They often understand the problem before the dashboard shows it.

Numbers are useful, but they are not perfect. A higher output figure may hide more defects, rushed inspections, or exhausted employees. That is why managers should review productivity through several measures, including throughput, first-pass yield, downtime, changeover time, and near-miss reports. Small experiments are safer than dramatic changes. Move one tool closer. Test one revised sequence. Check the result for a week.

Progress can be uneven. That is normal. Reliable improvement comes from disciplined observation, honest feedback, and repeated adjustment. This article explains practical ways to improve production line productivity while protecting quality, safety, and long-term operational stability.
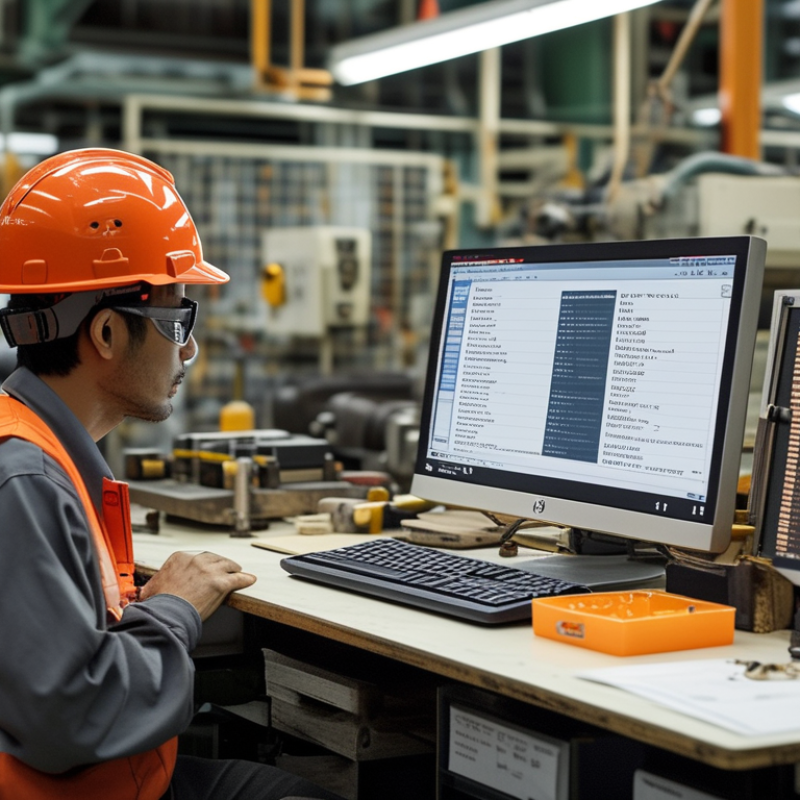
How to Improve Production Line Productivity?

Measure OEE Against the 85% World-Class Manufacturing Benchmark

Improving production line productivity begins with measuring OEE against the 85% world-class manufacturing benchmark. OEE combines availability, performance, and quality into one practical indicator. It shows whether a line is truly productive, not merely busy. A line running for ten hours may still lose output through changeovers, minor stops, slow cycles, and rejected parts.

Reliable measurement requires accurate shop-floor data. Record planned production time, unplanned downtime, actual cycle rates, and defective units. For example, a packaging line may show 92% availability but only 78% performance because operators frequently clear short jams. That gap deserves attention. Review the largest losses during daily meetings, then verify them beside the machine. Reports alone can hide uncomfortable details.

The 85% benchmark should guide improvement, not encourage careless comparisons. Product mix, maintenance conditions, staffing, and process complexity affect every result. A line at 83% may be improving steadily, while another at 86% may be masking poor quality records.

Look for evidence. Check downtime codes, inspect samples, and compare shift data. Short trials can test better changeover methods or maintenance intervals. Some actions will fail. That is useful, if the team records why and adjusts the next experiment. Small gains become credible when measurements remain consistent.

Identify the Six Big Losses Behind Production Line Inefficiency

Production Line Productivity: Identify the Six Big Losses

A productive line can still hide serious waste behind a good daily output. The six big losses provide a practical way to find it. Equipment breakdowns stop production completely, while setup and adjustment delays consume valuable changeover time. Record the exact minutes, not estimates. A five-minute delay repeated twelve times becomes one lost hour.

Idling and minor stops often look harmless, such as a sensor reset or a material jam. They quietly reduce availability. Reduced speed creates another loss when machines run below their designed rate. Compare actual cycle time with the standard cycle time during each shift. Our first review missed short pauses because operators restarted the line quickly. That was a measurement failure, not an operator failure.

The final two losses involve quality. Process defects include damaged parts, incorrect fills, and repeated inspections. Startup rejects appear after changeovers, when temperature, pressure, or alignment still needs adjustment. Separate these losses in the production log. A simple sheet can record time, cause, quantity, and corrective action. Maintenance teams can then inspect recurring faults, while supervisors can test one improvement at a time. Do not chase every problem at once. That approach sounds efficient, but it usually weakens accountability. A clean line is not always an efficient line. Even reliable equipment may lose productivity through speed variation, poor setup habits, or small unresolved stops.

Reduce Changeover Time by 30–50% with SMED Practices

How to Improve Production Line Productivity?

Reduce Changeover Time by 30–50% with SMED Practices

Production line productivity often drops during product changeovers. Machines wait, operators search, and prepared materials remain unused. SMED, or Single-Minute Exchange of Die, targets this lost time. The method separates internal tasks from external tasks. Internal tasks require a stopped machine. External tasks can happen while production continues. This simple distinction often reveals surprising delays.

Start by recording a real changeover with timestamps. Note every movement, adjustment, tool search, and quality check. A mobile video can expose repeated walking between the machine and storage area. Stage tools, labels, fasteners, and raw materials before shutdown. Use color-coded locations and clear checklists. Replace loose adjustments with preset guides where possible. Two trained operators can handle preparation and machine work in parallel. Standardized connectors and quick-release fixtures can reduce repeated fastening.

Measure the result carefully.

A 30–50% reduction is possible, but it is not automatic. Our first checklist would have been too detailed for a busy shift. Shorter instructions worked better beside the machine. Some teams also rush adjustments and create quality problems later. That trade-off requires attention. Track changeover minutes, startup defects, safety observations, and operator feedback. Review the data weekly, then revise the standard. A faster changeover has little value if the first production batch needs rework. Each improvement should make the next changeover easier, safer, and more predictable.

Use Predictive Maintenance to Cut Unplanned Downtime by 30–40%

Production line productivity improves when machines spend more time making good parts. Predictive maintenance targets the downtime that schedules often miss. Sensors track vibration, temperature, pressure, and motor current. Software compares these signals with normal operating patterns. A rising vibration reading may reveal bearing wear days before failure. Small warning. Technicians can then plan a repair during a scheduled changeover. This prevents a quiet shift from becoming an expensive stoppage.

In a practical pilot, teams commonly compare four measures: unplanned downtime, mean time between failures, repair time, and scrap. A well-designed program can cut unplanned downtime by 30–40%, but the figure is not automatic. It depends on sensor quality, clean data, and disciplined follow-up. Operators should record unusual noise, heat, leaks, and brief stops. Their notes add context that algorithms may miss.

Data needs context. Too many alerts become background noise.

Start with the bottleneck machine, not the entire factory. Install sensors at critical points and establish a four-week baseline. Review trends daily with maintenance and production staff. When a warning appears, verify it physically before ordering parts. This step is easy to skip. One false alarm can weaken trust, while one missed failure can erase a month of gains. Predictive maintenance works best as a shared routine, supported by clear thresholds, spare-parts planning, and honest review of every prediction.

Apply Digital Manufacturing Tools to Raise Productivity by 15–30%

How to Improve Production Line Productivity?

Apply Digital Manufacturing Tools to Raise Productivity by 15–30%

A connected production line can reveal losses that supervisors miss during busy shifts. Digital work instructions, machine sensors, and real-time dashboards turn scattered observations into usable evidence. In one practical pilot, operators tracked cycle time, minor stops, and changeover delays at each workstation. The team then tested small adjustments instead of changing the entire line.

A 15–30% productivity improvement is possible in suitable operations, but it is not guaranteed. Results depend on equipment age, process stability, data quality, and employee adoption. Start with one production cell. Record baseline output, downtime, scrap, and labor hours for several weeks. After installing simple monitoring tools, compare the same measures under similar conditions. This makes the improvement claim more credible.

The clearest gains often come from faster responses. A screen can flag a six-minute stoppage before it becomes an hour of lost output. Digital checklists can also reduce skipped inspections and inconsistent setups. Yet dashboards can create noise. Too many alerts frustrate operators, especially when problems cannot be fixed quickly. Training must include real machine scenarios, not only classroom demonstrations. Our own measurements can be imperfect when shifts record downtime differently. That weakness deserves attention. Standard definitions, regular data reviews, and operator feedback help turn digital tools into dependable productivity improvements.

How to Improve Production Line Productivity?

Apply digital manufacturing tools to raise productivity by 15–30%

The chart shows typical productivity uplift ranges associated with common digital manufacturing applications. A baseline productivity index of 100 represents the production line before implementation; the projected index increases to 115–130 after applying targeted digital tools.

FAQS

: What are the six big losses in production?

: They include breakdowns, setup delays, minor stops, reduced speed, process defects, and startup rejects. Small losses accumulate.

How should production losses be measured?

Record exact minutes, causes, quantities, and corrective actions. Avoid estimates. A repeated five-minute delay can become one lost hour.

What counts as a minor stop?

Examples include sensor resets, material jams, and brief operator interventions. These pauses may last seconds but occur repeatedly throughout a shift.

How can teams identify reduced-speed losses?

Compare the actual cycle time with the standard cycle time for each shift. A machine may run continuously while producing below its designed rate.

How should quality losses be separated?

Record process defects separately from startup rejects after changeovers. Track damaged parts, incorrect fills, repeated inspections, and adjustment-related rejects.

Can predictive maintenance reduce unplanned downtime?

A well-designed program may reduce unplanned downtime by 30–40%. Results depend on sensor quality, clean data, and consistent follow-up.

What warning signs can sensors and operators detect?

Sensors can monitor vibration, temperature, pressure, and motor current. Operators should also report unusual noise, heat, leaks, and brief stops.

How should a predictive maintenance program begin?

Start with the bottleneck machine and establish a four-week baseline. Verify warnings physically before ordering parts. False alarms can weaken trust.

Can digital tools improve production productivity?

Suitable operations may achieve 15–30% improvement with digital monitoring and clear work instructions. This result is not guaranteed.

What mistakes can weaken productivity improvement efforts?

Changing the entire line at once can weaken accountability. Too many alerts frustrate operators. Our measurements may also be inconsistent across shifts.

Conclusion

Improving production line productivity starts with measuring current performance against the 85% world-class manufacturing benchmark. Overall Equipment Effectiveness (OEE) provides a clear view of availability, performance, and quality, helping teams identify the six big losses that reduce efficiency, including equipment failures, setup delays, minor stops, slow cycles, production defects, and startup waste. Once these losses are measured, improvement efforts can focus on the causes with the greatest operational impact.

A practical approach to how to improve production line productivity is to apply SMED practices, which can reduce changeover time by 30–50% through better preparation and standardized procedures. Predictive maintenance can also lower unplanned downtime by 30–40% by identifying equipment problems before they interrupt production. In addition, digital manufacturing tools can provide real-time data, improve scheduling, and support faster decisions, potentially raising productivity by 15–30%. Together, these methods create a more stable, efficient, and continuously improving production process.

Sienna

Sienna

Sienna is a skilled marketing professional with a deep expertise in our company’s core products and services. With a passion for innovation and detail, she plays a pivotal role in crafting insightful blog posts that not only highlight the unique features of our offerings but also provide valuable......