China’s filling industry serves food, beverage, pharmaceutical, cosmetic, and chemical manufacturers. Each sector demands different control over speed, accuracy, hygiene, and product protection. A fast line is not automatically an efficient line. Small errors can become visible losses.
This guide explains how to optimize filling processes in production through ten practical methods. These methods include equipment calibration, nozzle selection, container handling, material preparation, and real-time monitoring. They also consider common conditions in Chinese factories, such as changing product batches, seasonal temperatures, limited floor space, and mixed production schedules. Operators may need to adjust each recommendation according to viscosity, foam formation, container shape, and required fill volume.
Details matter.
For example, a 500-milliliter bottle may show inconsistent levels after several hours of operation. The cause could be product temperature, pump wear, trapped air, or an incorrectly positioned nozzle. Regular checks can identify these issues before customer complaints increase. Professional teams should use documented procedures, traceable measurements, validated cleaning routines, and suitable quality standards. Maintenance records also help managers connect recurring defects with specific machines or shifts.
No production line is perfect. Some improvements may reduce one problem while creating another, especially when speed increases too quickly. This article therefore encourages controlled trials, operator feedback, and careful review of results. Reliable optimization comes from evidence, not assumptions. With disciplined testing and practical experience, manufacturers can improve filling accuracy, reduce waste, protect product quality, and build a more stable production system.
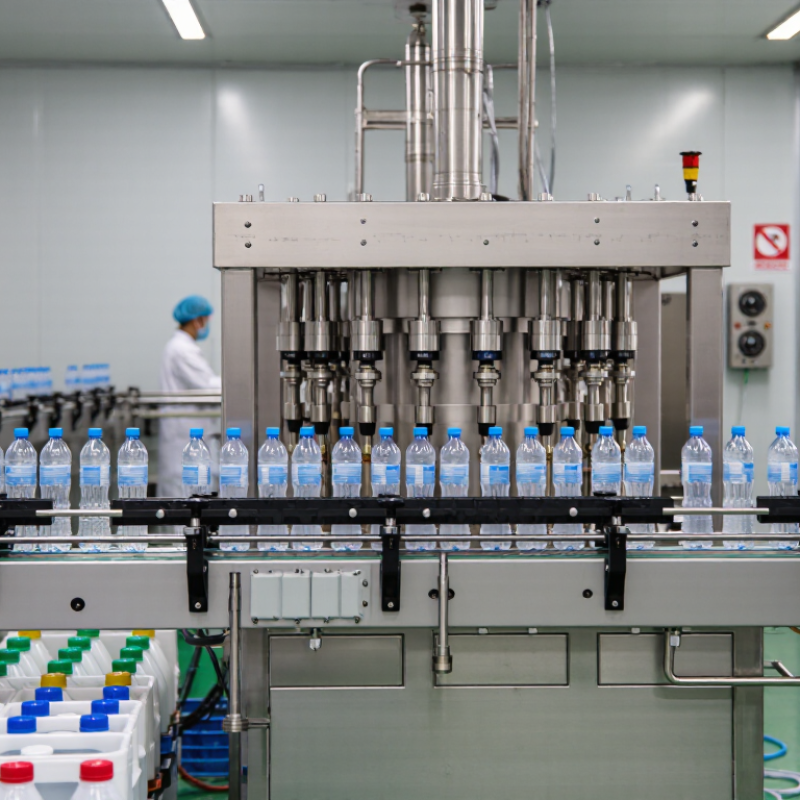
China’s top 10 filling process optimization methods focus on measurable control, not guesswork. Plants can track filling accuracy, line speed, downtime, rejects, and cleaning time. The strongest results usually come from combining these indicators.
The ten practical methods include calibrating filling valves, controlling product temperature, stabilizing supply pressure, and reducing foam. Operators can also optimize nozzle height, standardize container positioning, and inspect seals during each shift. Automatic weight checks reveal small volume changes before waste increases. Preventive maintenance protects pumps, sensors, and conveyor timing. Digital batch records improve traceability and support faster root-cause analysis. Finally, structured operator training reduces handling differences between shifts. Some facilities report accuracy improvements after tighter calibration, but results vary with product viscosity and container design. That limitation matters.
Tips: Set a clear baseline before changing equipment settings. Measure at least three production runs. Record temperature, pressure, fill weight, and reject levels. Small changes are easier to verify. Do not trust speed alone. A faster line may create more underfilled containers, spills, or unstable seals. Walk the line during operation. A gauge may look normal while product drips from a worn nozzle. My practical view is simple: data should guide adjustments, but experienced operators still notice details sensors miss. The process will not become perfect. It can become more predictable.
The chart ranks practical filling-process improvement methods using a transparent 0–100 prioritization index based on expected process impact, implementation effort, data readiness, and scalability. It is a comparative industry framework rather than company-specific performance data.
Higher scores indicate stronger overall priority for reducing fill-volume variation, downtime, waste, and changeover losses.
Filling performance depends on more than machine speed. A stable process protects product quality, labor efficiency, and delivery reliability. Overall Equipment Effectiveness (OEE) combines availability, performance, and quality. An 85% result is a strong industry benchmark, but it should guide improvement rather than become a cosmetic number.
Start with accurate data from every filling shift. Record planned production time, unplanned stops, slow cycles, changeovers, rejects, and rework. A five-minute sensor delay can distort the dashboard. Check losses at the line, filler, capper, conveyor, and inspection points. Small gaps often repeat throughout the day. Reduce changeover time with prepared tools, clear settings, and standardized cleaning steps. Verify fill volume regularly, because quality losses can quietly reduce OEE.
Tips: Review OEE by shift and product format. Separate mechanical stops from material shortages. Watch the first ten minutes after startup. That period often exposes poor setup. Set daily actions for the largest loss, not every loss at once. An 85% target may be unrealistic for an unstable line, and forcing the number can encourage inaccurate reporting. A lower, trustworthy result is more useful than a perfect-looking dashboard. Technicians and operators should confirm the causes together, using timestamps, samples, and maintenance records. Improvement is rarely linear. Some changes will fail. Test them, document the result, and adjust the standard.
China Top 10 Ways to Optimize Filling Processes
Achieving filling accuracy within ±0.5% requires disciplined control, not a single machine adjustment. Chinese production teams can begin by calibrating load cells before each shift and checking container tare weights. Stable product temperature also matters because viscosity changes can alter flow speed. Keep the supply tank level consistent, and control pressure near the filling valves.
Use clean, correctly aligned nozzles to prevent dripping and uneven starts. Deaerate foamy liquids when practical, since trapped bubbles create false volume readings. Set a slower speed during the final filling stage, then apply a short settling delay before weighing. Inspect shutoff valves regularly. Small errors multiply.
Record every batch in a simple process log. Track target weight, actual weight, temperature, pressure, and rejected units. Statistical checks can reveal drift before waste becomes expensive. Operators should verify the first ten containers, then sample at planned intervals. A sealed reference weight can help confirm scale performance during production.
Experience shows that ±0.5% is realistic for many stable products, but it is not automatic. Powder, foam, and high-viscosity materials may require different settings. One weakness remains common: teams often adjust flow speed without investigating product behavior. That shortcut may improve one batch and damage the next. Review the data, question unusual readings, and refine settings carefully.
| No. | Optimization Method | Recommended Practice | Key Control Variable | Typical Target or Result | Waste-Reduction Effect | Priority |
|---|---|---|---|---|---|---|
| 1 | Calibrate Filling Equipment | Calibrate load cells, flow meters, pistons, and dosing pumps using traceable test weights or certified volumetric standards before production. | Calibration deviation and repeatability | Routine verification within ±0.5% of the target fill weight or volume | Reduces systematic overfilling and underfilling | High |
| 2 | Control Product Temperature | Maintain a stable product temperature when viscosity or density changes with temperature, especially for oils, syrups, sauces, and creams. | Product temperature and viscosity | Keep temperature within the validated process range | Improves dosing consistency and lowers batch-to-batch variation | High |
| 3 | Optimize Filling Speed | Use a controlled acceleration and deceleration profile rather than operating continuously at the maximum machine speed. | Cycle speed, acceleration, and shut-off timing | Increase speed only after accuracy and product stability are confirmed | Limits splashing, foaming, dripping, and inconsistent cut-off | High |
| 4 | Apply Closed-Loop Control | Use real-time feedback from checkweighers, flow meters, or servo position sensors to automatically correct the next filling cycle. | Actual fill result versus setpoint | Automatic correction based on measured deviation | Prevents repeated errors during long production runs | High |
| 5 | Standardize Container Positioning | Use guides, star wheels, neck grippers, or indexing systems to keep every container centered beneath the filling nozzle. | Nozzle-to-container alignment | Consistent nozzle height and horizontal alignment | Reduces splashing, off-center filling, and container contamination | Medium |
| 6 | Select the Correct Nozzle Design | Match nozzle diameter, shut-off mechanism, and insertion depth to the product viscosity, foaming tendency, and container opening. | Flow pattern, dripping, and foam generation | Stable flow with clean shut-off at the end of each cycle | Reduces product loss around the container neck and machine deck | High |
| 7 | Use Recipe and Parameter Management | Store validated settings for each product and container format, including dose, speed, delay, pressure, and nozzle position. | Parameter consistency between changeovers | Repeatable start-up settings with controlled changeover checks | Minimizes start-up rejects and operator adjustment waste | Medium |
| 8 | Improve Product Supply Stability | Maintain steady supply pressure and tank level; remove air from the product path where aeration can affect dosing. | Pressure, head height, and entrained air | Stable pressure and level within validated operating limits | Prevents fluctuations in fill volume and reduces foaming-related losses | High |
| 9 | Establish Statistical Process Control | Record fill-weight or fill-volume samples at defined intervals and use control charts to identify trends before limits are exceeded. | Mean, range, standard deviation, and control limits | Stable process centered on the nominal target | Detects drift early and reduces excessive corrective filling | Medium |
| 10 | Maintain and Clean Critical Components | Inspect seals, valves, pistons, filters, hoses, and nozzles; remove buildup that can change flow resistance or cause leakage. | Seal condition, leakage, and flow-path cleanliness | Preventive maintenance completed at defined intervals | Maintains accuracy and avoids unplanned product leakage | High |
Note: The ±0.5% accuracy objective should be validated for each product, container, filling technology, and operating range. Actual results depend on product properties, equipment condition, environmental conditions, and measurement-system capability.
China Top 10 Ways to Optimize Filling Processes
Apply CIP Systems to Cut Cleaning Time by 30%–50%
Cleaning delays can reduce filling output and increase water, labor, and chemical use. A well-designed Clean-in-Place (CIP) system may cut cleaning time by 30%–50% in suitable operations. Results depend on equipment design, product residue, and validated cleaning recipes. The system circulates water and cleaning solutions through tanks, pipes, valves, and filling heads without manual dismantling. Operators should monitor flow speed, temperature, chemical concentration, and return-water clarity. These details reveal whether each surface receives enough mechanical action. A stable recipe also improves repeatability between production shifts.
Tips: Record every CIP cycle. Check conductivity and temperature at key points. Set alarms for weak flow or low concentration. Inspect spray devices regularly, because small blockages can create large hygiene risks. Keep clear records for internal review and regulatory audits.
The first cycle is rarely perfect. A shorter program may leave product film inside a valve seat or narrow pipe. That mistake can cause repeated cleaning, wasted water, and production risk. Test each step with approved verification methods, then adjust time carefully. Do not reduce cleaning time only because the rinse water looks clear. Experienced teams compare test results, equipment history, and operator observations. A practical improvement may be simple: improve drainage, remove dead legs, or correct an uneven pipe slope. These changes can support faster cleaning without weakening process control.
China Top 10 Ways to Optimize Filling Processes
A reliable filling line starts with stable product conditions. Control temperature, viscosity, and tank pressure before changing machine settings. In Chinese factories, even a small viscosity shift can alter fill weight during long production runs. Use automated dosing with servo control, closed-loop feedback, and automatic nozzle adjustment. Record every batch in a digital production log. This makes deviations easier to trace.
Vision inspection adds another control layer. Cameras can check fill level, cap position, seal condition, label placement, and container damage at line speed. Set clear image standards with calibrated lighting and fixed camera angles. Reject units immediately with a controlled air blast or mechanical diverter. Keep rejected bottles in a locked, visible tray. Operators should review samples hourly, not trust the screen blindly. Our early trials showed that condensation created false alarms. Drying airflow and better lighting solved part of the problem.
Use statistical process control to monitor weight trends before defects increase. Schedule nozzle cleaning, sensor checks, and camera calibration by production hours. Train operators to question unusual data. Do not hide small failures. A reported two percent error can reveal a larger issue. Achieving over 99% inspection accuracy requires validated samples, stable materials, and regular system testing. Clean containers are not enough. Test transparent, colored, scratched, and partly filled containers. Human review still matters when images look uncertain. Automation improves consistency, but poor settings can repeat mistakes faster.
On high-throughput filling lines in China, hygienic design begins before equipment arrives. A practical review maps product flow, personnel movement, drains, utilities, and cleaning access. Remove dead legs, exposed threads, sharp corners, and difficult-to-drain pipe sections. Use smooth, cleanable surfaces and continuous sanitary welds. Keep raw and clean zones physically separated. Place sensors where operators can inspect them without touching product-contact surfaces. That small detail matters.
For 10,000-plus bottles per hour, stable dosing needs calibrated flowmeters, pressure controls, and consistent bottle handling. Validate each critical setting during normal speed, start-up, shutdown, and brief stoppage conditions. Challenge the filler with repeatable tests for fill volume, temperature, microbial control, and container closure. Record acceptance limits before testing begins. Cleaning validation should confirm time, temperature, chemical concentration, flow velocity, and final rinse quality. Use residue swabs and rinse samples from difficult cleaning points. A fast cycle is not automatically a safe cycle.
Operators need clear procedures, visual checks, and training records linked to actual tasks. Automated alarms should identify drift before underfilled bottles reach packaging. Review rejected bottles by time, station, and failure type. This exposes hidden patterns. In practice, teams sometimes overtrust automated cleaning results. That is a weakness worth admitting. Manual inspection, trend reviews, and periodic revalidation can reveal problems software misses. Keep every change controlled, justified, and traceable through production records.
OEE combines availability, performance, and quality. It shows how much planned production becomes acceptable output. The number is not everything.
An 85% result is a useful benchmark, not a universal requirement. An unstable line may need a lower, trustworthy target first.
Record planned time, unplanned stops, slow cycles, changeovers, rejects, and rework. Include timestamps and station details.
A five-minute sensor delay can distort the dashboard. Repeated small gaps may hide losses across the entire day.
Prepare tools, confirm settings, and standardize cleaning steps. Keep the sequence visible near the equipment. It may still need adjustment.
Watch the first ten minutes closely. Check fill volume, bottle handling, alarms, and rejected containers. Startup often reveals poor setup.
Remove dead legs, exposed threads, sharp corners, and hard-to-drain pipes. Use smooth surfaces and continuous sanitary welds.
Check cleaning time, temperature, chemical concentration, flow velocity, and final rinse quality. Use swabs and rinse samples from difficult points.
Review rejects by time, station, and failure type. Compare them with maintenance records and production samples.
Software can miss practical problems. Manual inspections, trend reviews, and periodic revalidation provide useful evidence. Some assumptions will fail.
Optimizing filling processes in production requires a data-driven approach focused on efficiency, accuracy, hygiene, and consistent quality. Start by measuring line performance through Overall Equipment Effectiveness (OEE), with a target of 85% or higher to identify downtime, speed losses, and quality issues. Filling accuracy should be controlled within ±0.5%, helping reduce material waste and maintain consistent product volume. Modern Clean-in-Place (CIP) systems can also shorten cleaning cycles by approximately 30%–50% while supporting reliable sanitation procedures.
Further improvements can come from automation and vision inspection, which help achieve quality accuracy above 99% and reduce dependence on manual checks. Hygienic equipment design, documented validation, and regular process monitoring are especially important for high-speed lines producing more than 10,000 bottles per hour. Together, these methods provide a practical framework for how to optimize filling processes in production, improve throughput, reduce operational losses, and maintain stable product quality.

Selltrion Packaging